|
Analysis
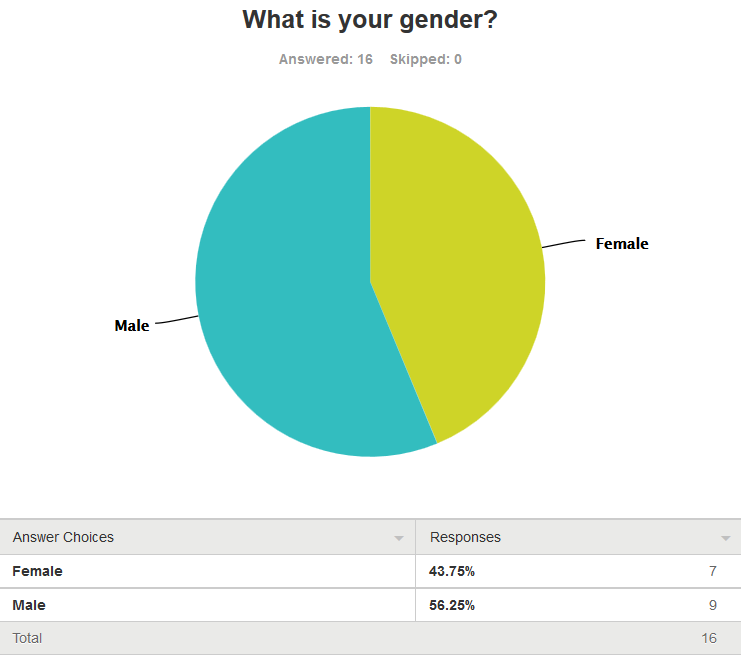
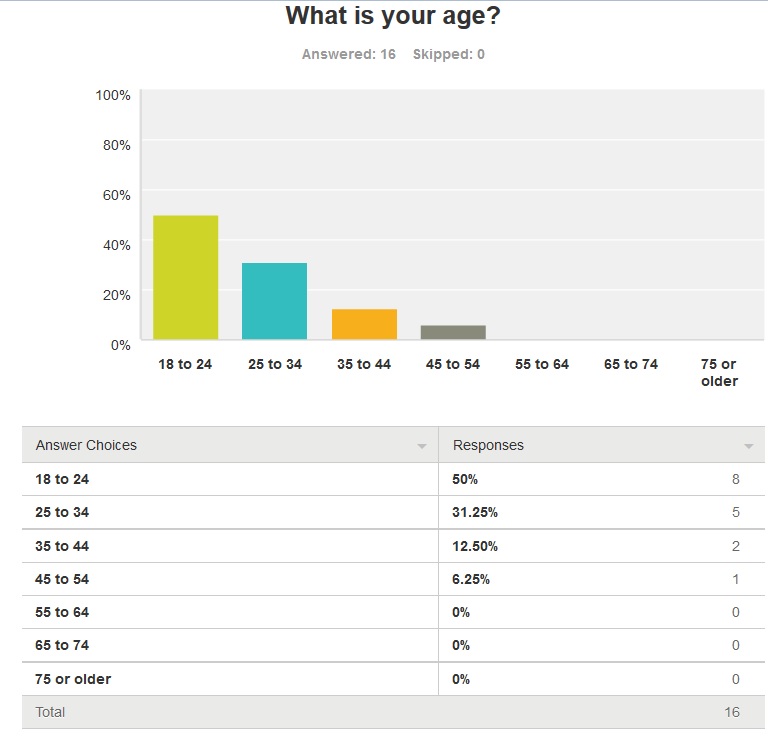
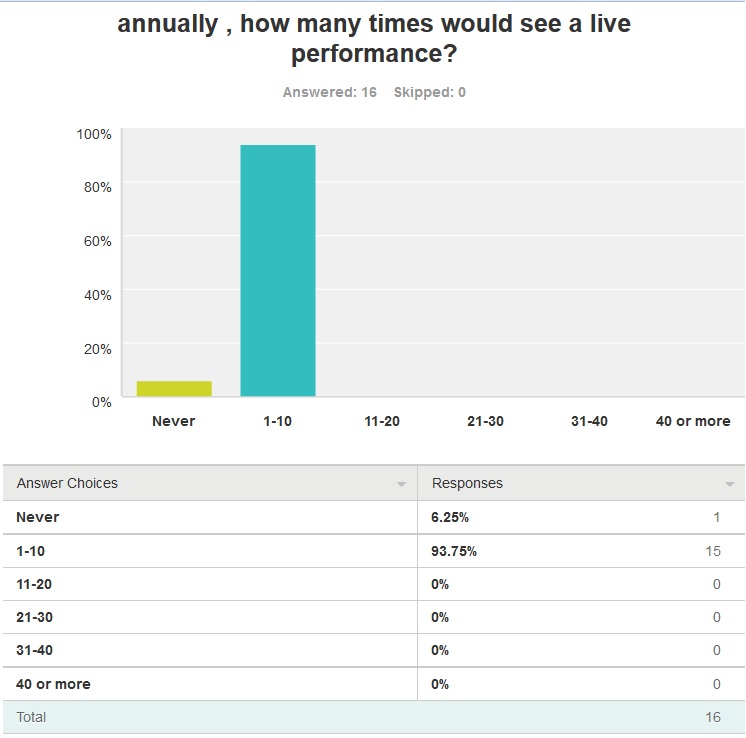
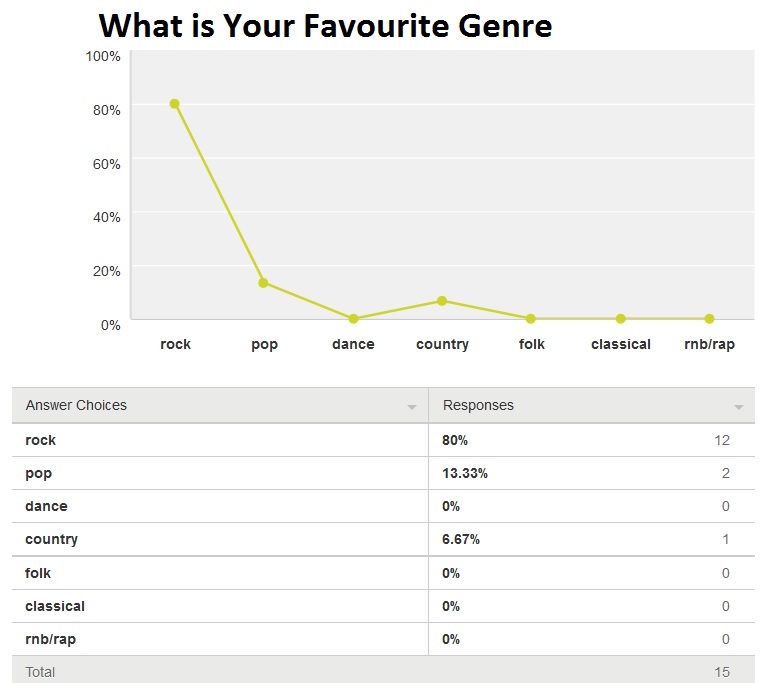
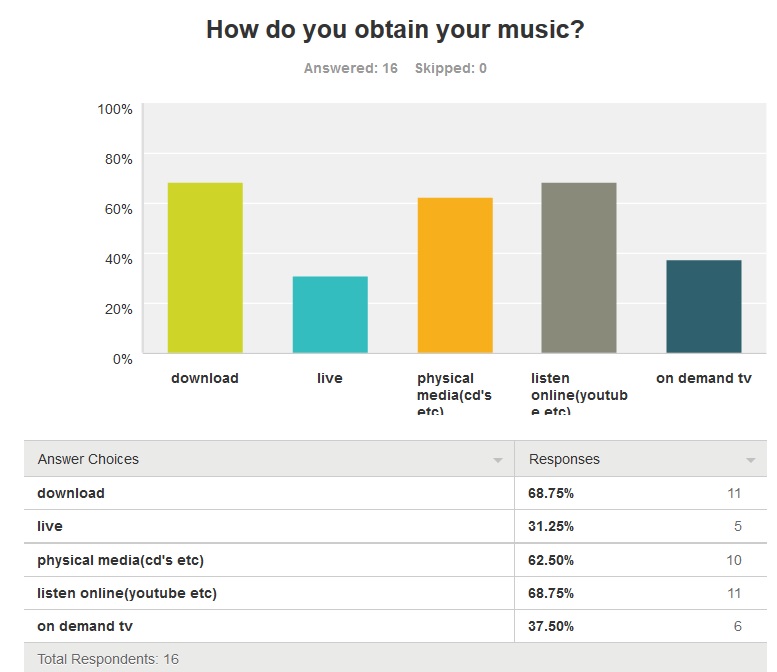
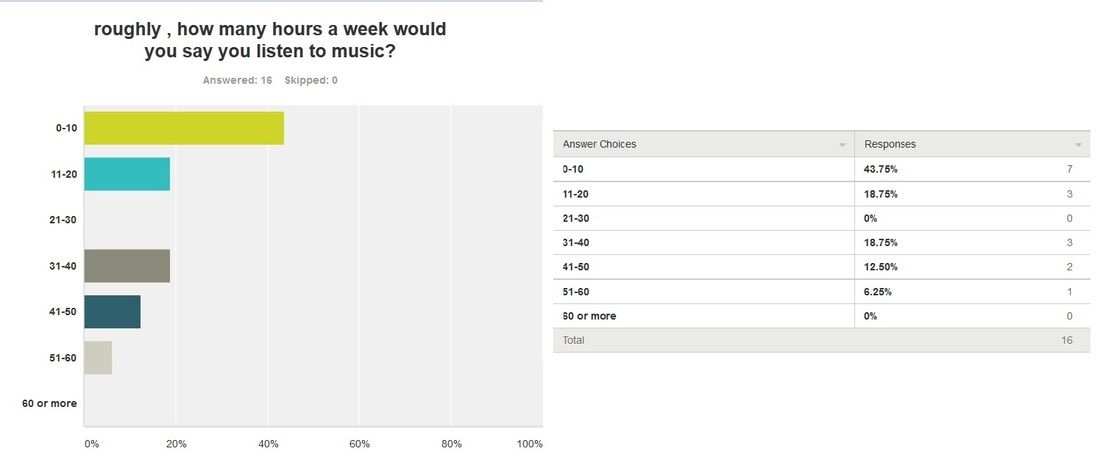
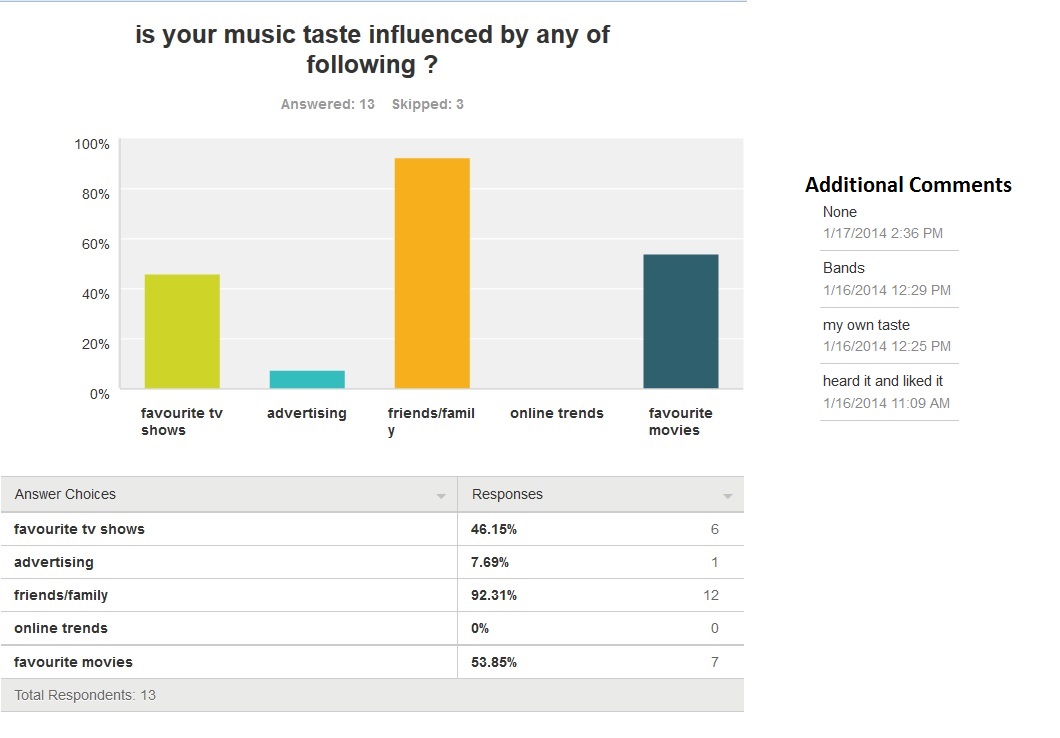
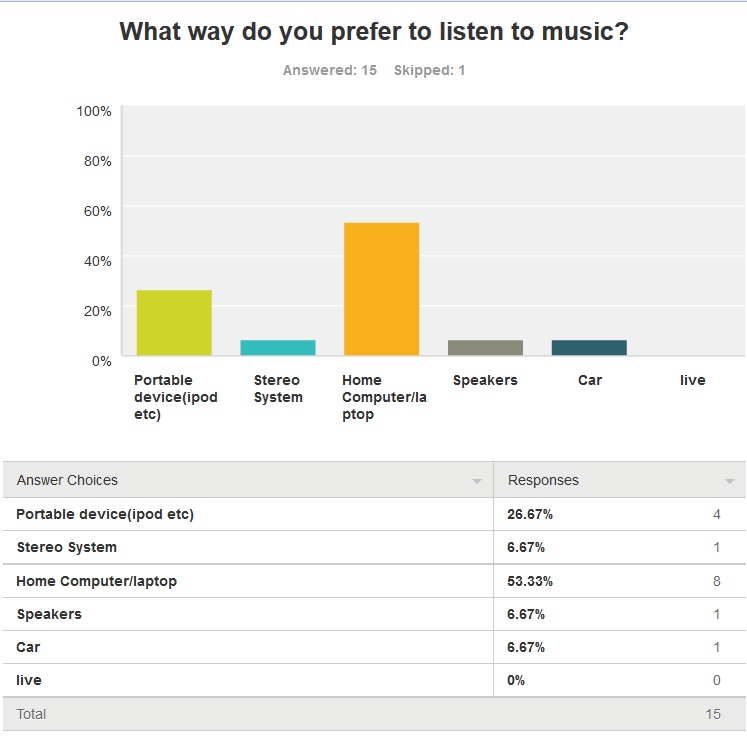
I created a Music questionnaire using www.surveymonkey.com consisting of ten questions relating to people's taste in music and related music questions, I then distributed the questionnaire by posting a link to the survey on my private facebook page and asking friends to fill it in , 16 people participated in the survey 9 male and 7 female, the questions i asked are explained underneath and results represented graphically on the right . Question 1&2 The question's i asked for 1&2 were forename and surname , in hindsight the results were not necessary as there was no link between name and music taste Question 3 The first question that I asked was gender , the results were more male particpants than female , 56.25% male and 43.75% , this result was not surprising and can be put down to how the questionnaire was distributed via facebook. Question 4 For this question I asked how old the participant was , in age range starting from 18 up to 75 and older , the most popular age group was 18-24(50%) followed closely by 25-34(31.25%) which was not a surprise as this reflects how the questionnaire was distributed using social media via a link on my facebook page, social media is more commonly used by people of the two most popular age group's and also the majority of people with access to my page consist of these age group's. Question 5 For this question I asked , how often the participant would see a live music performance within a calender year , the resounding result from the control group was 1-10 annual(93.75%) with the remainder of participants stating that they never see live music performances making up the other 6.25%. This could reflect the price of live concerts over music at home. Question 6 The next question I asked was favourite genre of music , the most popular choice was rock with 80% of participants choosing rock as there favorite type of music , the second most popular was pop music with 13.33% of participants choosing this and the results were made up by 1 participant choosing country as favourite genre and 1 participant chose indie but this was not reflected in the results but as this is a sub genre of rock music this reiterates that rock was most popular genre. Question 7 The next question I asked was to find out about how the participants obtained their music , I made this question multiple choice because people use many ways , the joint most popular method was download or to listen online(chose 11 times 68.75% each) followed by physical media selected 10 times(62.50%) , on demand TV was chosen 6 times(37.50%) with live the least popular with 5 (31.25%), this shows online based music was more popular with the participants this may be down to music being more widely available via the internet. Question 8 For this question I asked the participants roughly how often they listen to music weekly , in hours starting 0-10 hours up 60 hours a week , the most popular response was 0-10 hours , with 7 participants choosing this(43.75%) , 11-20 hours was joint second most popular with 31-40 hours with 3 participants each(18.75%), 2 participants(12.5%) chose 41-50 hours and finally 1 participant(6.25%) chose 51-60 hours , the result for this question was quite predictable as the average album last's 1-1 ½ hours , in theory if you listen to one album a day or a few tracks off an album a day it will add up to about 10 hours a week. Question 9 For this question I asked the participants “ is your music taste influenced by any of the following” with the choices being favourite TV show , advertising, Friends/family, online trends and favourite movies I also gave the participants an other box so that they could put there own influences in , the most popular influence was friends/family 92.31% participants chose this, followed by favourite movies 53.85% of participants chose this , favourite TV shows was chosen by 46.15% , and 7.69% said they were influence by advertising , one participant put that they were not influenced by any of the choices , others suggested bands, their own taste and hearing the song and liking it , the friends/family is the predictable result as people spend the majority of their time with friends and family. Question 10 The last question that I asked the participant's was what way do you prefer to listen to music , the resounding result was home computer/laptop(56.33%) this ties in with the previous question on how the participants obtained their music , with download and view online the most popular choices it was natural that they would listen to music on devices that allow you to obtain music by download and internet use , with portable devices second most popular with 26.67% of participants preferring this , stereo , speakers and car all had 6.67% of the control groups preference with no one prefering live this could be down to advances in quality/quantity of music available at home . |
Music Questionnaire
|